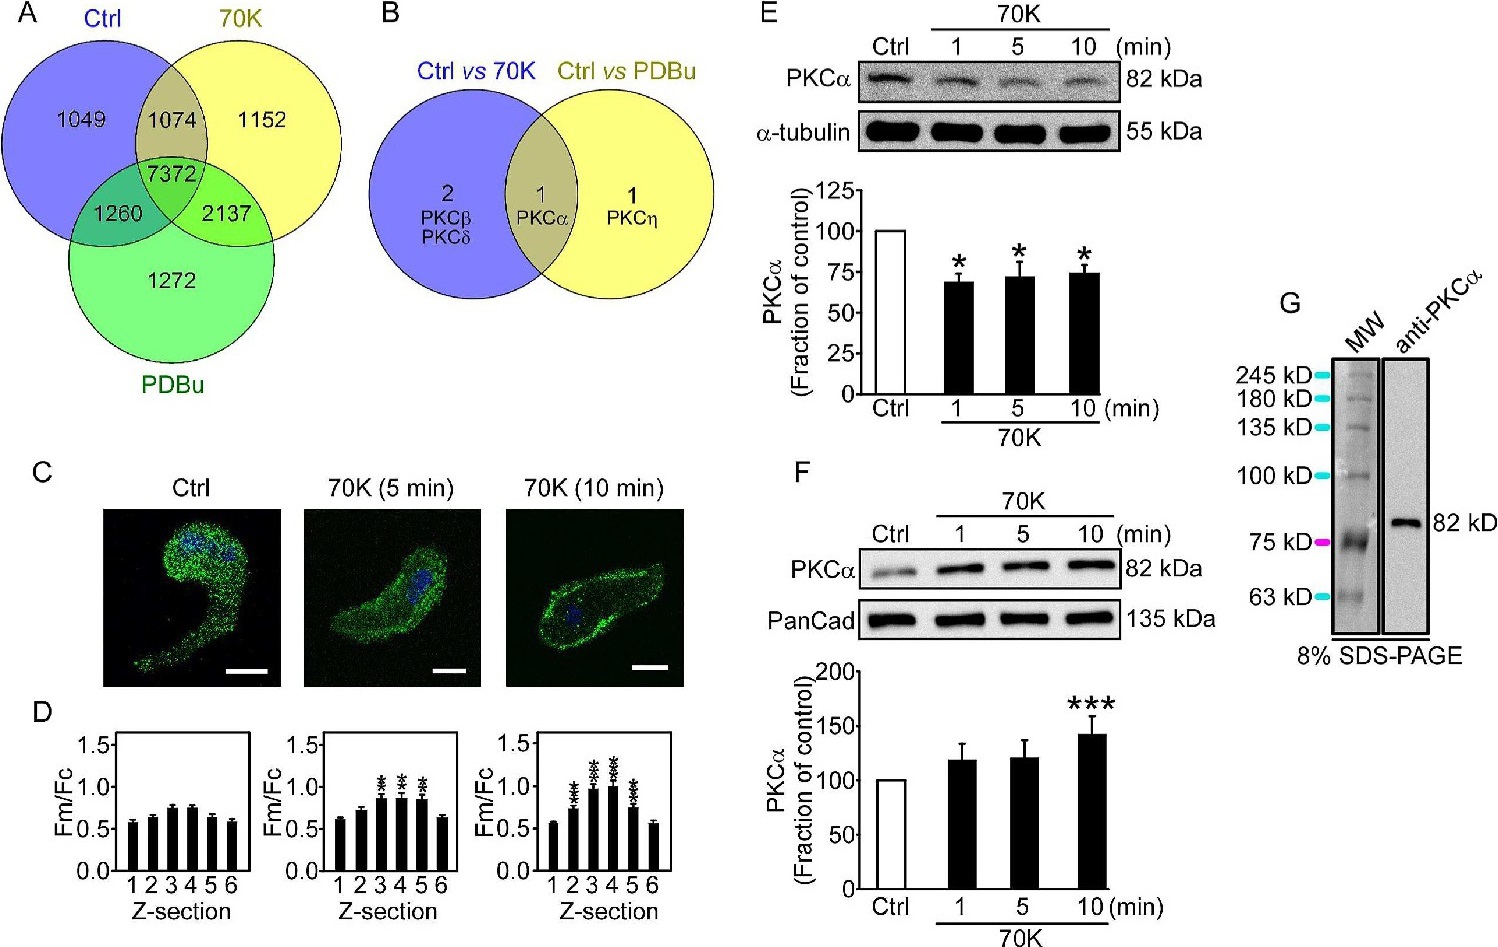
Fig. 1. Analysis of the role of PKCα in depolarized arteries. (A) Venn diagram indicating the number of proteins differentially regulated after exposure to control, 70K or PDBu (0.2 µM) for 10 minutes (data from IPA analysis). (B) Venn diagram representing up-regulated (more than two folds) PKC isoenzymes detected in 70K vs. control and PDBu vs. control in rat aorta and femoral arteries. The cut-off for the threshold fold change differences were ≥ 2.0 for upregulation and ≤ 0.5 for downregulation with Z-score between +2 and -2. (C) PKCα distribution (PKCα, green; cell nucleus, blue) in a femoral VSMC in control and after stimulation with 70K for 5 and 10 min. Scale bar, 8 µm. (D) Fluorescence intensity analyses (averaged peripheral (Fm):cytosolic (Fc), Fm/Fc) for different Z sections in control and depolarized conditions (n = 15-20 cells of different independent experiments). Representative immunoblots and analyses of PKCα in the cytosolic (E) and membrane fractions (F) from arteries incubated in 70K (n = 9-16). (G) Western blot confirming that the antibody detects a band of the expected molecular weight (~ 82 kDa). Molecular weight standards (visible, left columns) for 8 % SDS-PAGE and western blotting (chemiluminescence, right columns) of rat arterial homogenates. Statistical significance was calculated by Kruskal-Wallis test followed by Mann-Whitney U test. *P<0.05, **P<0.01, ***P<0.005 vs. control.